Seasonal
and Spatial Variation in Burglary Incidents in Philadelphia
According to Bureau of Justice Statistics (BJS), seasonal patterns are a popular topic on crime, showing how environmental factors may be related to crime throughout the year.
INTRO & MOTIVATION
Based on BJS’s findings from 1993 to 2010’s crime data, seasonal patterns exist for household property victimization, including burglary and household larceny, with higher crime rates in the summer and lower rates during other seasons of the year.
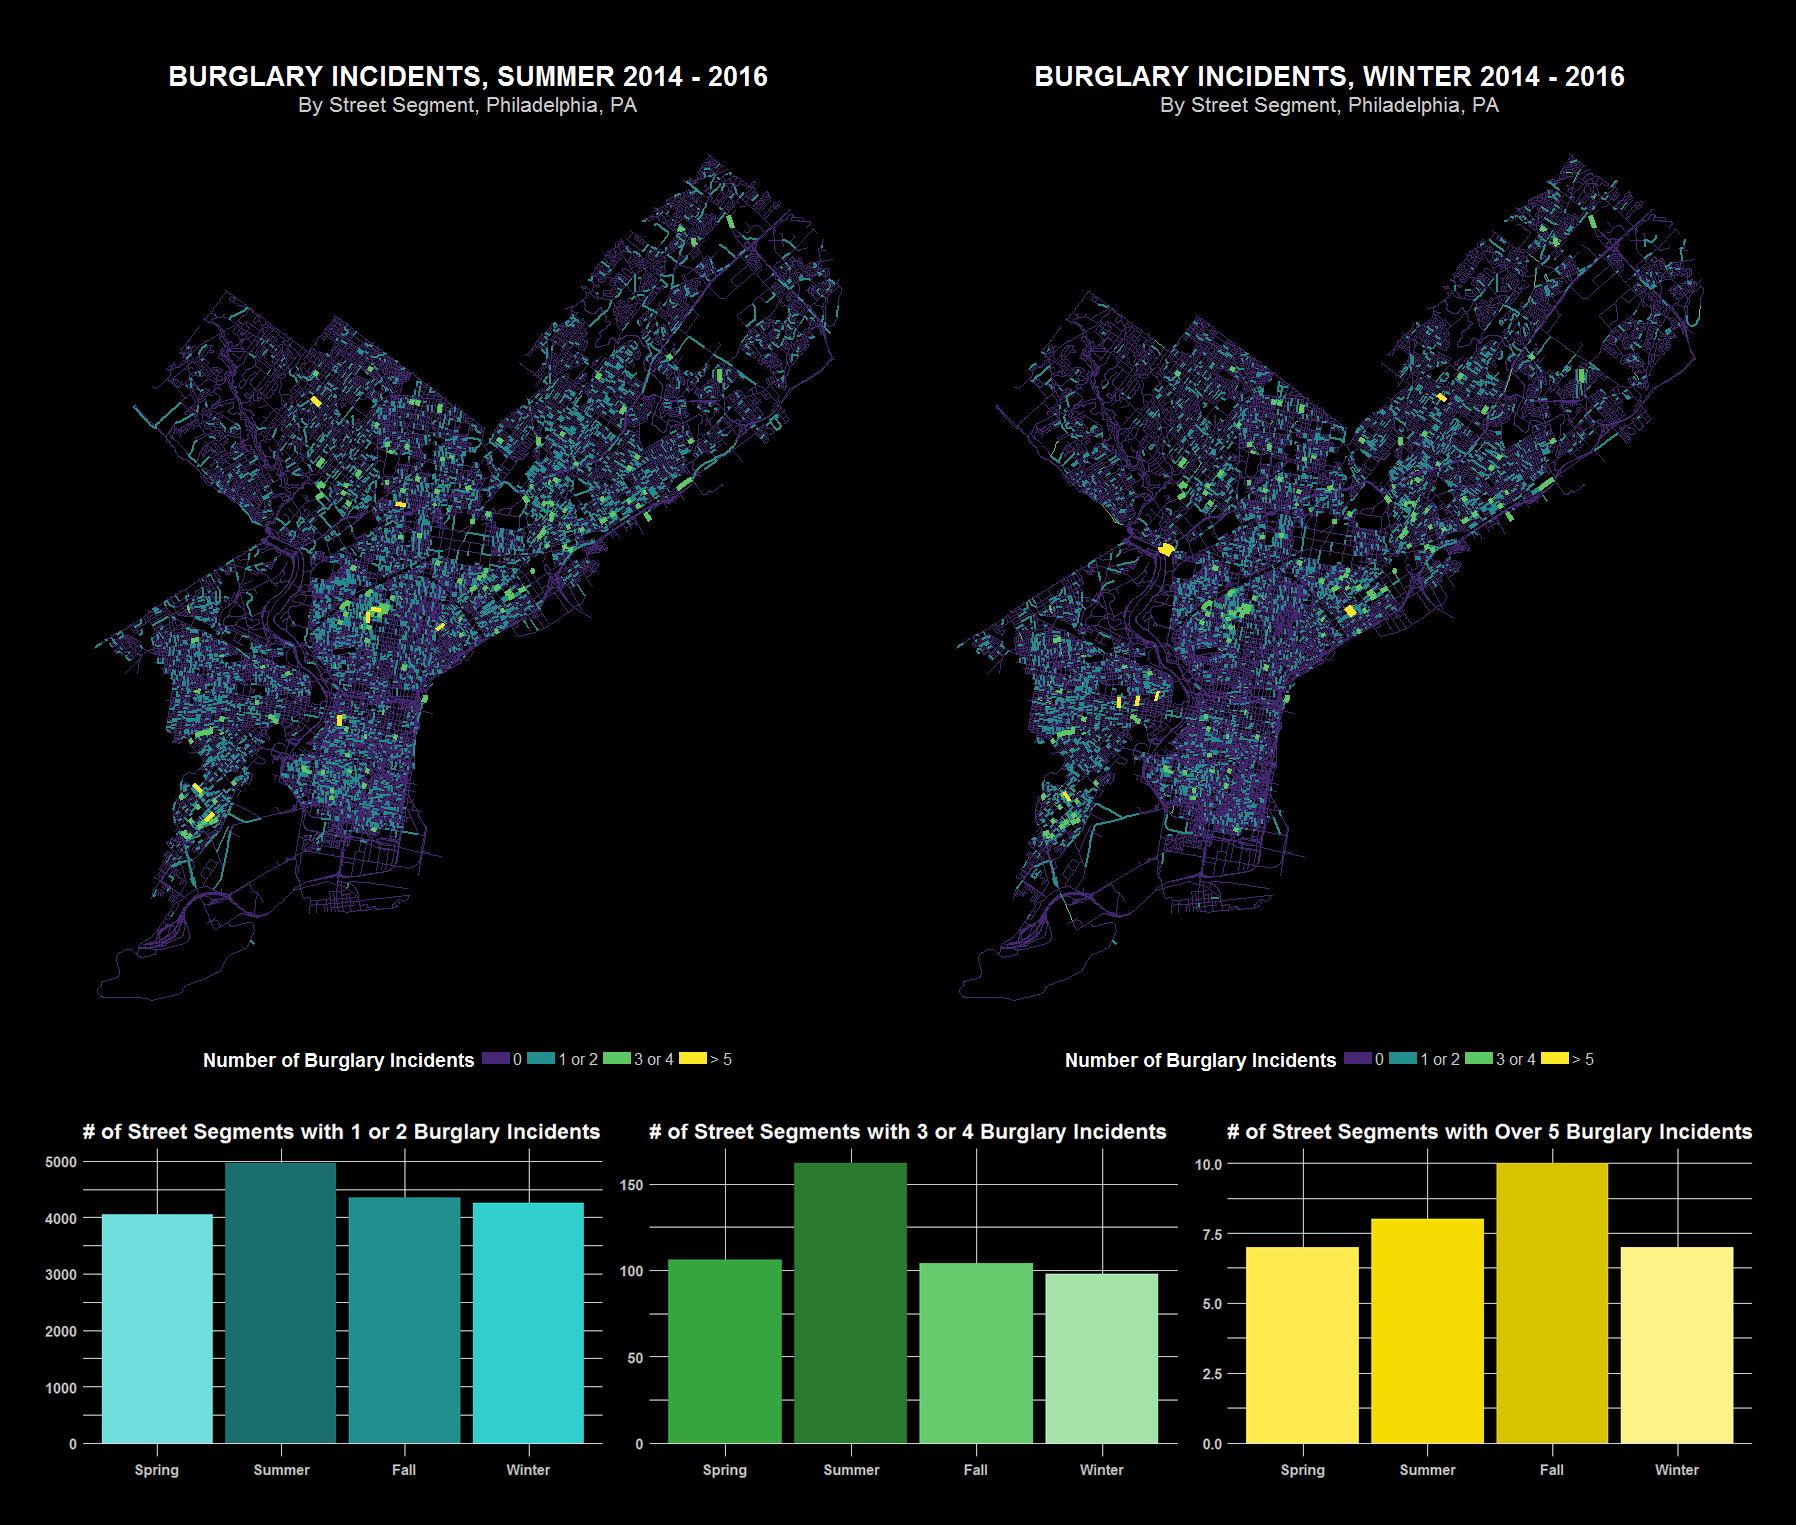
After reading BJS’s report, I am wondering whether the same seasonal patterns also exist for burglary incidents in Philadelphia, after the year of 2010. Besides, I want to visualize any spatial patterns at the street segment level in Philly in terms of burglary incidents. In this project, I will compare the spatial pattern of burglary incidents at the street segment level in Philadelphia in summer and winter of 2014 to 2016 in the form of maps, and present 3 bar plots comparing the count of burglary incidents in all four seasons from 2014 to 2016. I only map and compare burglary incidents in summer and winter because I speculate that incidents in summer and winter will exhibit the most obvious differences.

Seasonal and Spatial Pattern in Burglary Incidents
Philadelphia, PA, 2014 - 2016
Philadelphia, PA, 2014 - 2016
METHOD
This project is done using R and SQL.
1. Data Collection and Cleaning
- Download 10 years of Philadelphia crime data (2006 - 2017), which contains 2,000,000 rows of data. Download Philadelphia street segment shapefile (street centerline)
- For Philly street segment shapefile, I read it, project it for future distance calculation, and write it to database. For the csv file containing Philadelphia crime data, I transform it to a sf object based on longitude and latitude.
- With my goal of examining 3 years of the most recent crime data, I selected 2014-2016 crime data points from the original dataset. Since I want to examine only burglary incidents, I filtered the dataset by selecting only “Burglary Non-Residential” and “Burglary Residential”. At this point I obtained a filtered dataset of all burglary incidents from 2014 to 2016 in Philadelphia (24,610 rows of data).
- I also added a column to the filtered burglary dataset: season, based on the time of each burglary incident. The cleaned burglary dataset was then written to database.
2. Spatial Queries
- To accelerate the process of running spatial queries, I first create spatial index for street segment dataset and burglary dataset in the database.
- I use a spatial query to associate burglary incidents with street segments based on this criterion: the incident is within 100 m of the street segment (took about 10 minutes). To expedite the process, I in fact ran two spatial queries to associate burglary incidents in summer and in winter with street segments (took less than 5 minutes in total). The two generated datasets were written to database again.
- I then use another two spatial queries to count the number of burglary at each street segment in winter and in summer.
- Finally, I joined the aggregated datasets with burglary count with the original street segments dataset for map plotting. All segments without burglary count were assigned a value of 0.
- Click here for spatial queries code. Note that adding index is an essential step for reducing the processing time of spatial queries.
3. Data Visualization
- Put together maps and bar plots in R

Animated GIF Visualizing the Difference in
Spatial Distribution of Burglary Incidents between Summer and Winter
Philadelphia, PA, 2014 - 2016
Spatial Distribution of Burglary Incidents between Summer and Winter
Philadelphia, PA, 2014 - 2016
RESULTS
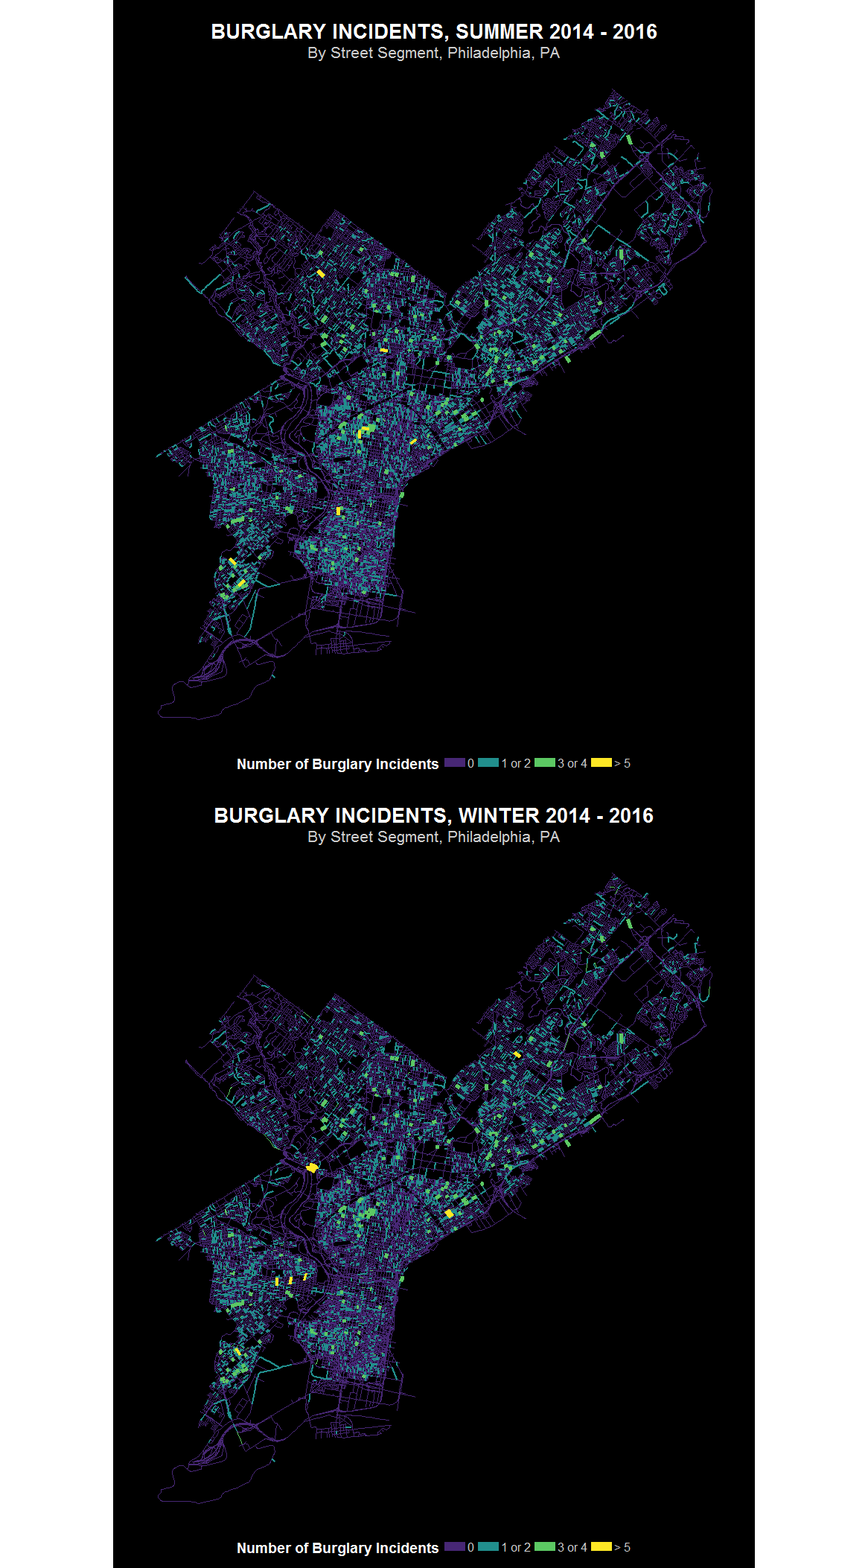
From the final map we can see that, indicated by the area covered by lighter color and thicker lines, there are more burglary incidents in summer than in winter in general. This is clearly shown in the gif image. For the category “1 or 2”, the spatial distribution of burglary count is very different in summer and in winter. Many street segments do not have any burglary incidents in winter but have some in summer. There are also some streets where burglary incidents occur in winter but not in summer. For the category”3 or 4”, it is interesting that the burglary incidents count is kind of consistent between summer and winter. In other words, the street segments with 3 or 4 burglary incidents in summer tend to have similar number of burglary incidents in winter. For the category “>5”, the spatial distribution of burglary count is very different in summer and in winter again.
From the bar plot, we can see that in two of the three bar plots, the “summer” bar has the highest number, which indicates that more street segments have burglary incidents in summer than in winter. In the category “3 or 4” though, the “fall” bar has the highest number. For “winter” bar, it usually has the smallest number.
All in all, we can conclude from the map that seasonal patterns of burglary incidents do exhibit from 2014 to 2016 in Philadelphia at street segment level. Overall, there are more burglary incidents in summer than in other seasons, and there tend to be fewer burglary incidents in winter. However, at each street segment level, the seasonal pattern may not be obvious or may not exist. The result of this study could also help notify property owners living in the street segments with high count of burglary to be more careful about their property and tell them when they should be more careful about it. For policy makers, studying seasonal and spatial pattern on burglary incidents could help them make proper policy in respond to the seasonal factors that may cause people to conduct burglary crime in a particular season or time.