Predictive Modeling
Rebalancing the Bikes
The BIG problem: For all bike share system, while some stations do not have enough bikes for riders to check out, other stations are lack of empty docks for riders to park their bikes.

The DivvyX App
User interface mock up
User interface mock up
The Solution: Predictove Model and APP Design
Chicago Divvy bike share system faces the same problem, and we want to propose a data-driven approach to solve it: building a predictive model forecasting future number of bikes at each Divvy station across Chicago.
The model can be applied to our proposed App, Divvy X, which allows bikeshare operators to check how many bikes are likely to be at each Divvy station in the future. Our goal is to help the bikeshare rebalancers reallocate bikes more proactively and plan their work everyday more efficiently. For how this App works and how the model supports it, plese watch our YouTube video!
Due to the limitation of data available, in this project, we are only able to predict the hourly bike departures from 150 Divvy bike stations in downtown Chicago. However, the model building process can serve as a starting point for future exploration of this topic. The R markdown document explains in detail how we conduct this project.
The Model: Poisson Regression
For the project, we initially considered OLS regression model. However, the count of bike trip departures in each station is not normally distributed and there are a lot of zero count values, which means that if we have the bike trip departure as the dependent variable in OLS regression, the assumption of normality of residuals will be violated.
Moreover, the distribution of bike trip departures from stations is subject to a lot of factors such as weather, the day of the week, the time of the day(i.e. there would be more bike trip departures during rush hours). Hence, we consider the bike trip departure may have a Poisson distribution.
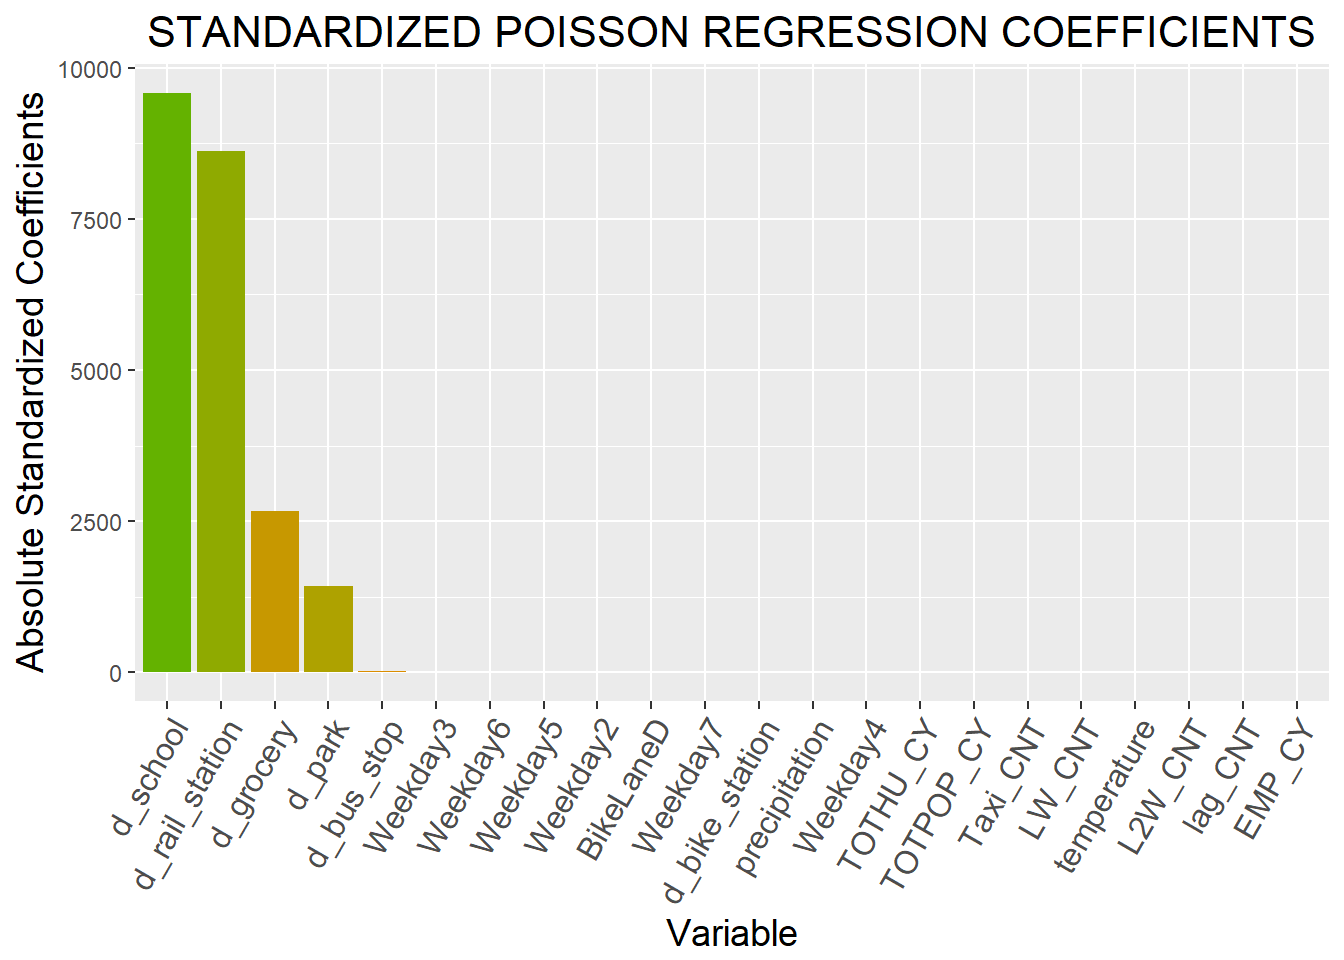
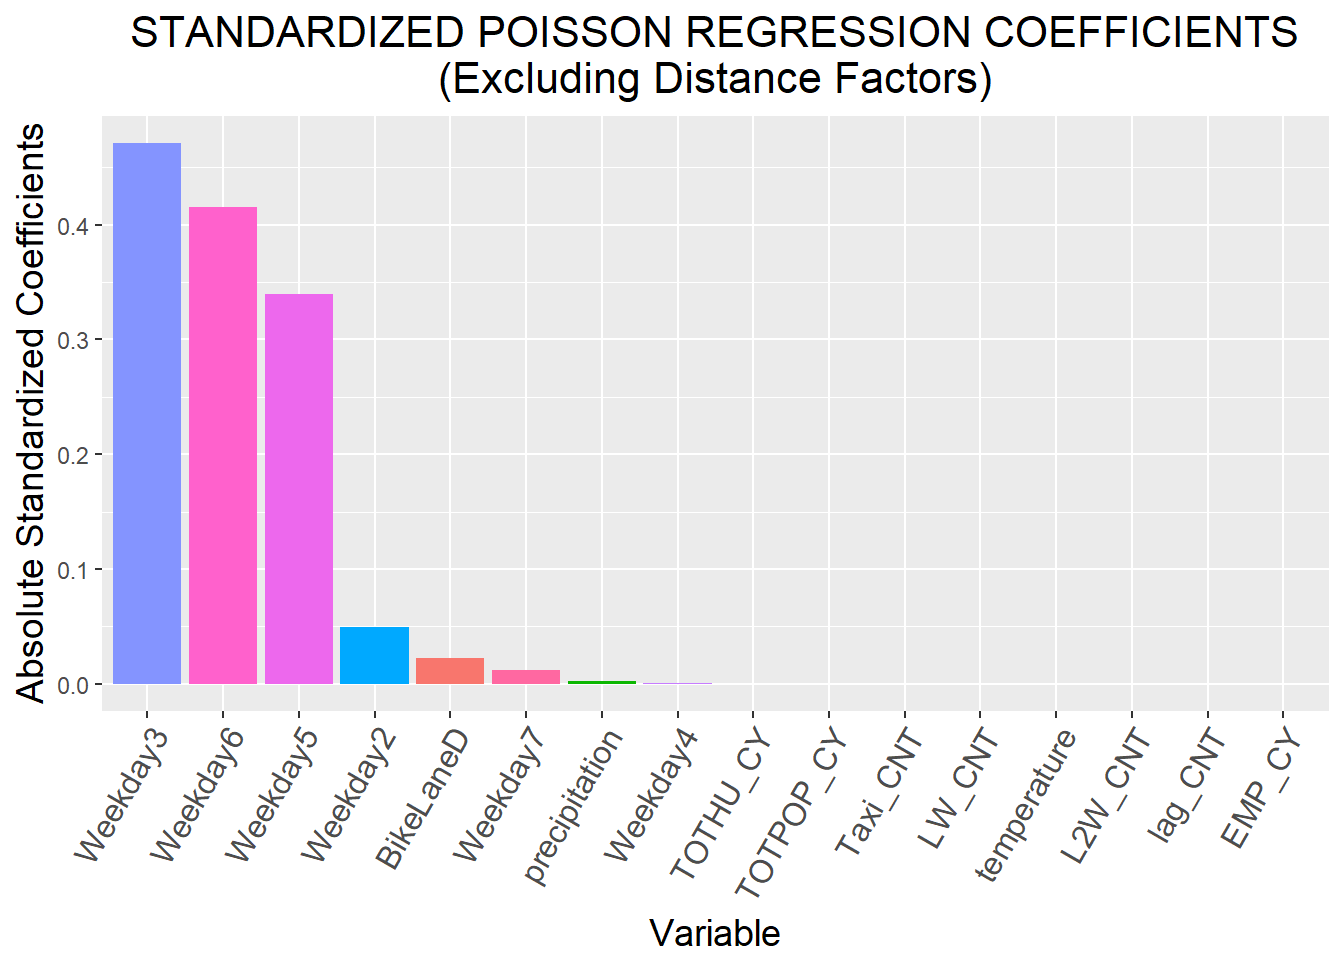
Impact of Predictors
Standardized Coefficient Graphs
Standardized Coefficient Graphs
The Data: Spatial, Time, Weather and More
Dependent variable: Bike trip counts per hour for 150 Divvy stations closest to the center of downtown Chicago
Training Dataset: Hourly bike trip counts from June 11 to June 17, 2017
Test Dataset: Hourly bike departures on June 21 (weekday) and June 24 (weekend day), 2017
Independent Variables:
- Distance to Bus Stop (d_bus_stop)
- Distance to Public School (d_school)
- Distance to Grocery Store (d_grocery)
- Distance to Park (d_park)
- Distance to Railway Station (d_rail_station) Distance to Nearby Bike Station (d_bike_station)
- Bike Lane Density (BikeLaneD)
- The Day of the Week (Weekday1…Weekday7) Bike Trips Departures in Last Hour (lag_CNT)
- Bike Trips Departures in Last Week (LW_CNT)
- Bike Trips Departures in Last 2 Week (L2W_CNT) Total Population (TOTPOP_CY)
- Total Housing Unit (TOTHU_CY)
- Employed Population (EMP_CY)
- Temperature (temperature)
- Precipitation (precipitation)
- Taxi Trips (Taxi_CNT)
Our regression result shows that all of our selected predictors are significant. The standardized coefficient charts we create help visualize the impact of our selected predictors.

General Prediction Results
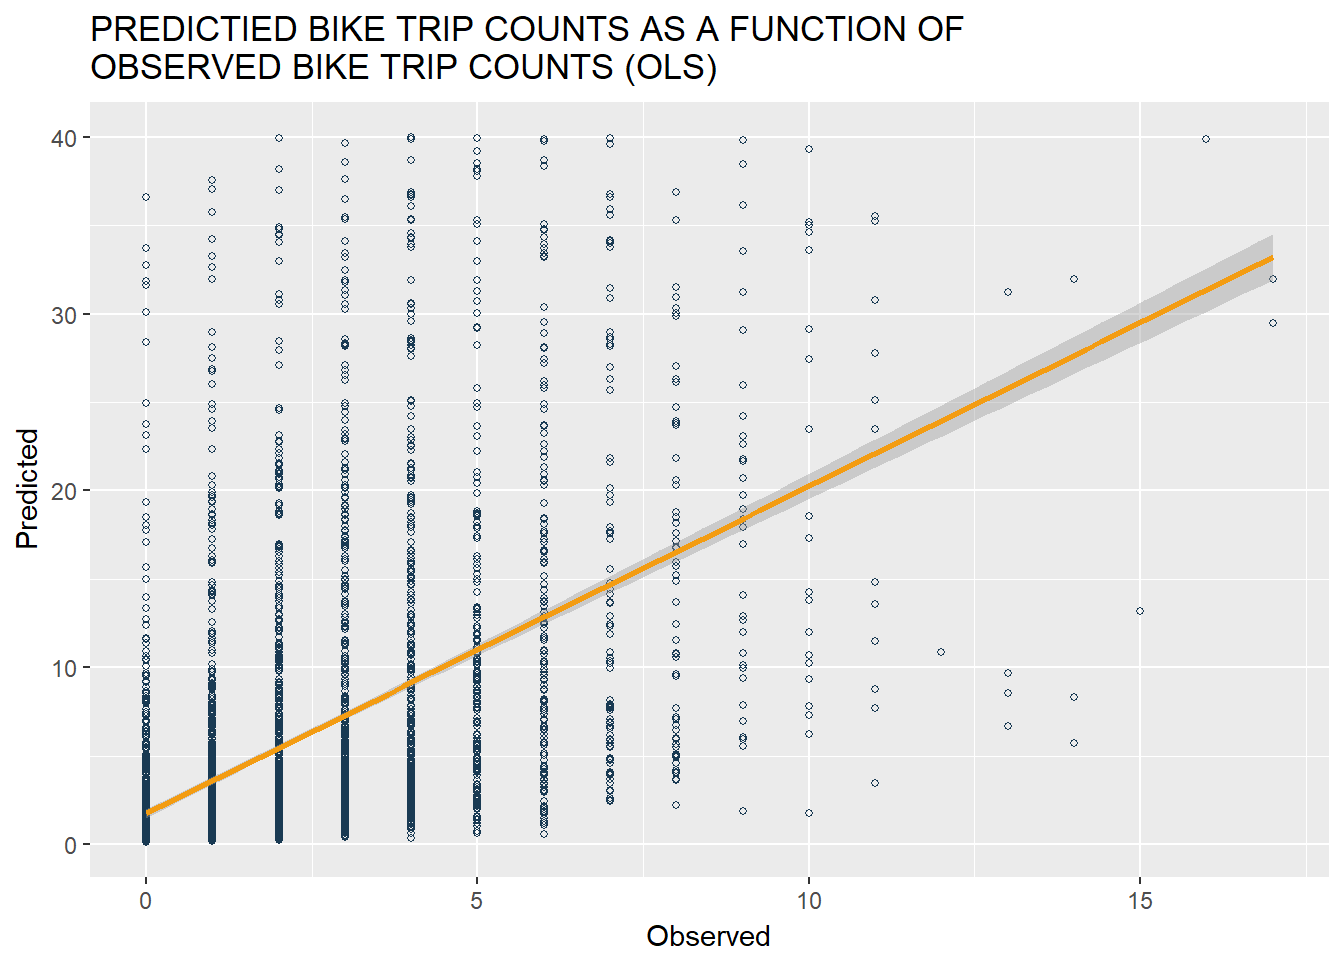
Poisson vs. OLS
Poisson vs. OLS
Model Comparison: Poisson Regression vs. OLS
Just to comfirm our initial thought that OLS regression is not suitable for this project, we run both Poisson regression and OLS regression on our training dataset and predict the bike trip departures for our test dataset using both models.
We plot predicted bike trip counts as a function of observed bike trip counts. The plot on the left shows the result of Poisson regression model while the plot on the right shows OLS regression’s prediction result. Overall, many of our predicted hourly bike trips based on Poisson model match with their observed values closely, which reaffirms to us that Poisson regression model would perform better overall than OLS regression model.

Temporal Prediction Results
Monday to Sunday
Monday to Sunday
The Results: Successfully Captures General Temporal-Spatial Pattern
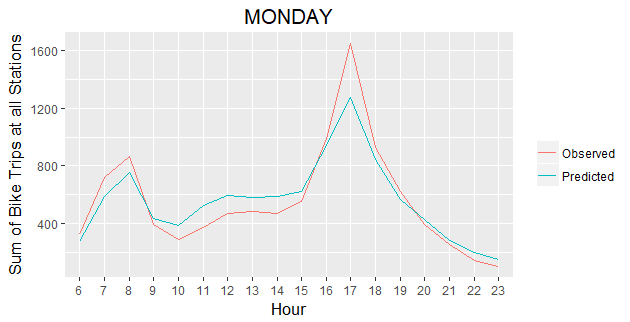
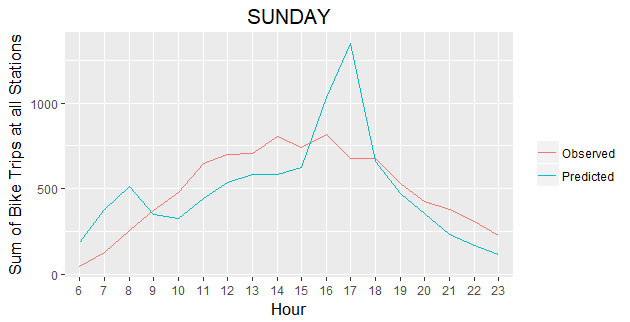
1. Predicted vs. Actual Bike Trips for All Stations by Hour Over a Week
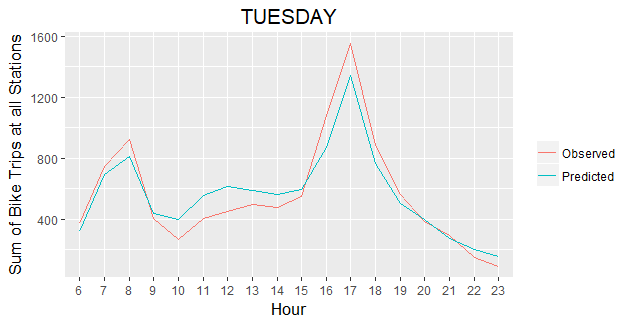
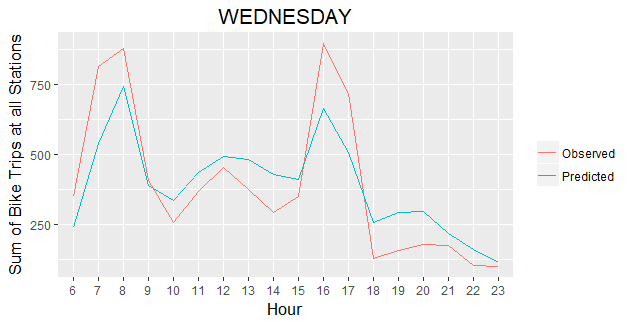
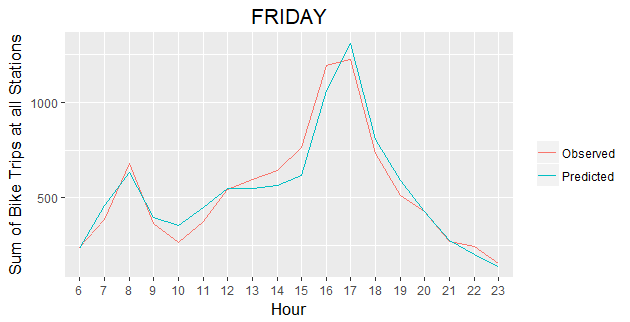
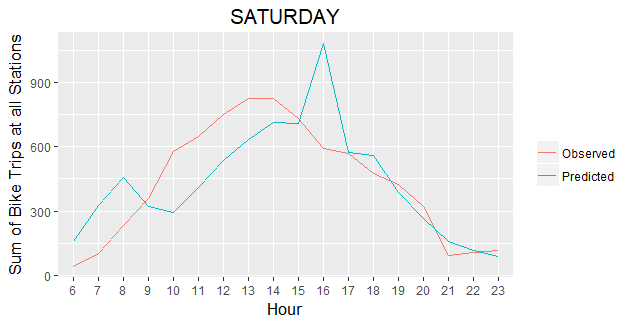
We further investigate the quality of our Poisson regression model by generating 7 plots comparing predicted vs. actual bike trips for all Stations by hour over the selected week. The 7 graphs show that our model captures the general trend of bike trips change during each day of a week. Especially for weekdays, our predicted results match very closely with the actual bike trip counts.


Spatial Prediction Results
Monday to Sunday
Monday to Sunday
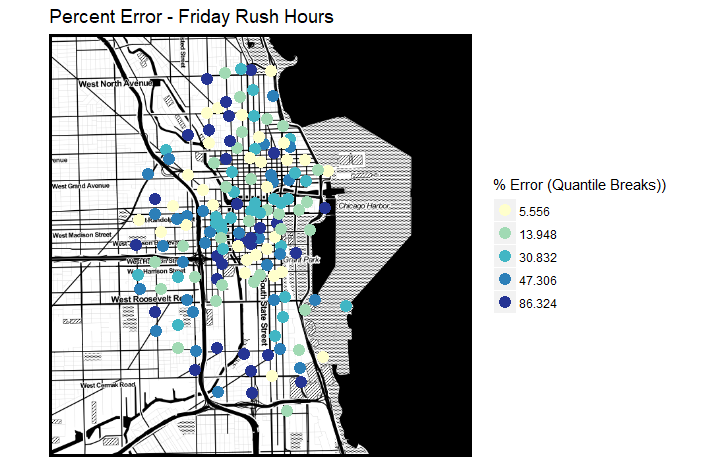
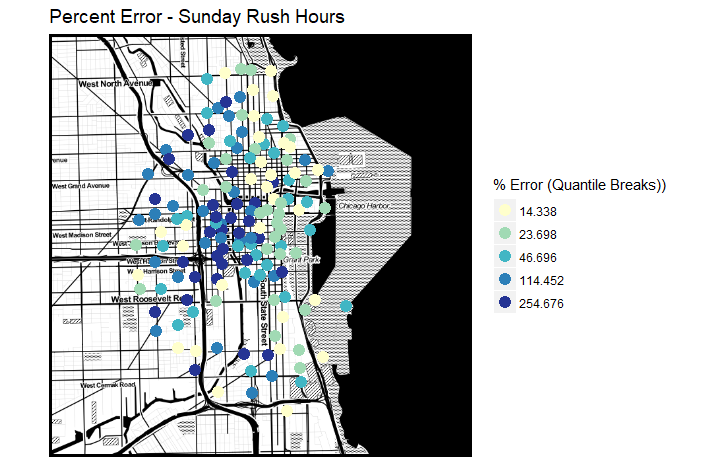
2. Percent
Error per Station over a Week during Rush Hours
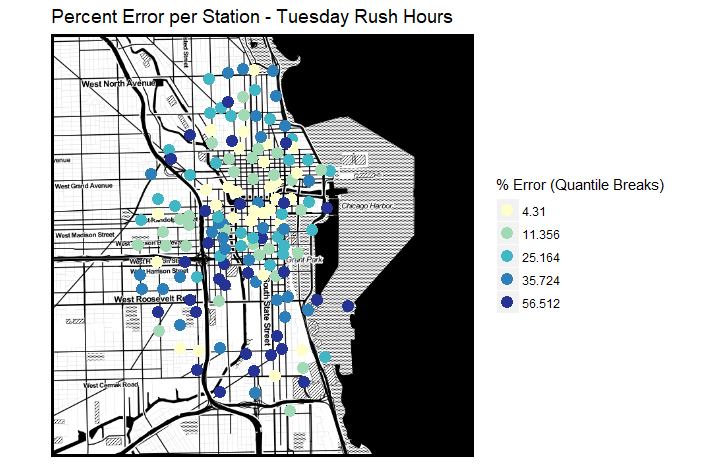
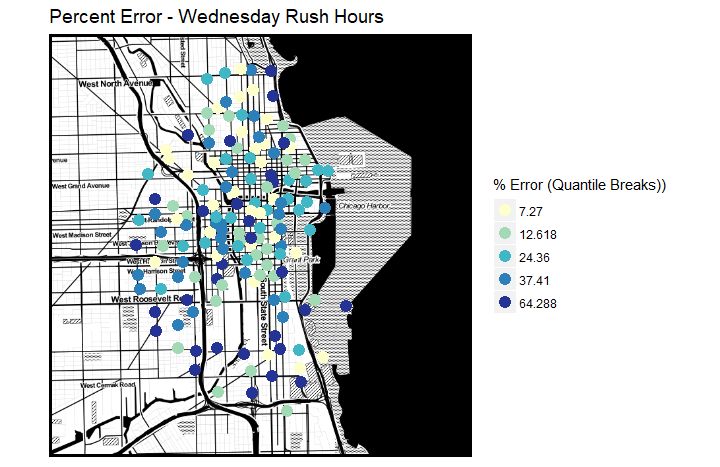
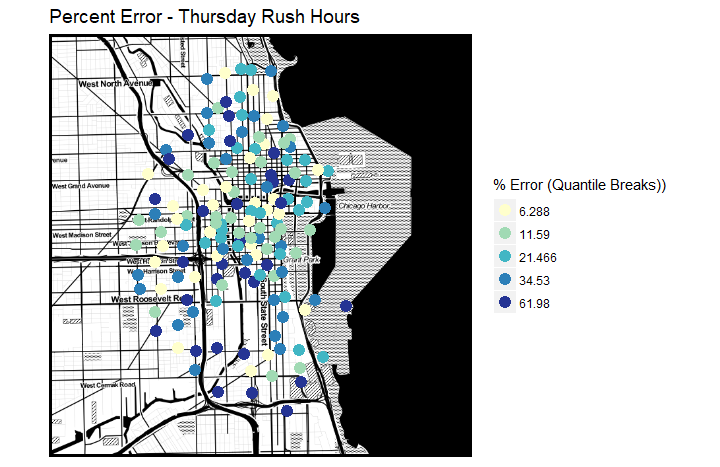
We create another 7 maps to show the prediction power by station in a week. Since it is a great challenge to rebalance bikes during rush hours, we decide to create the percent error maps to visualize how well our model predicts spatially for rush hours over a week. These maps show that overall, our model predicts better for stations near CBD.
We create another 7 maps to show the prediction power by station in a week. Since it is a great challenge to rebalance bikes during rush hours, we decide to create the percent error maps to visualize how well our model predicts spatially for rush hours over a week. These maps show that overall, our model predicts better for stations near CBD.

The Limitation: Possible Improvements
We conduct cross-validation for our training dataset as another way to investigate the model quality, as it enables us to see how generalizable the goodness of fit of our model is. We plot two histograms showing the cross-validation Mean Absolute Error (MAE) and Root Mean Square Error (RMSE) for our model. The RMSE and MAE are not ideal.
The model results indicate that there are some possible ways to enhance the model, such as adding more predictive variables. Also, in addition to the hourly departure bike trips, we may use the hourly change of bike trips at each station as our dependent variable. Lastly, we may consider using a non-linear regression model to capture distinct trends of each individual station.
These potential improvements would better support the function of our App and benefit Divvy bike share system.