Chicago Crime Risk Terrain Model
The risk terrain modeling (RTM) aims to predict where an assault crime
will happen in Chicago, IL based on Poisson regression.
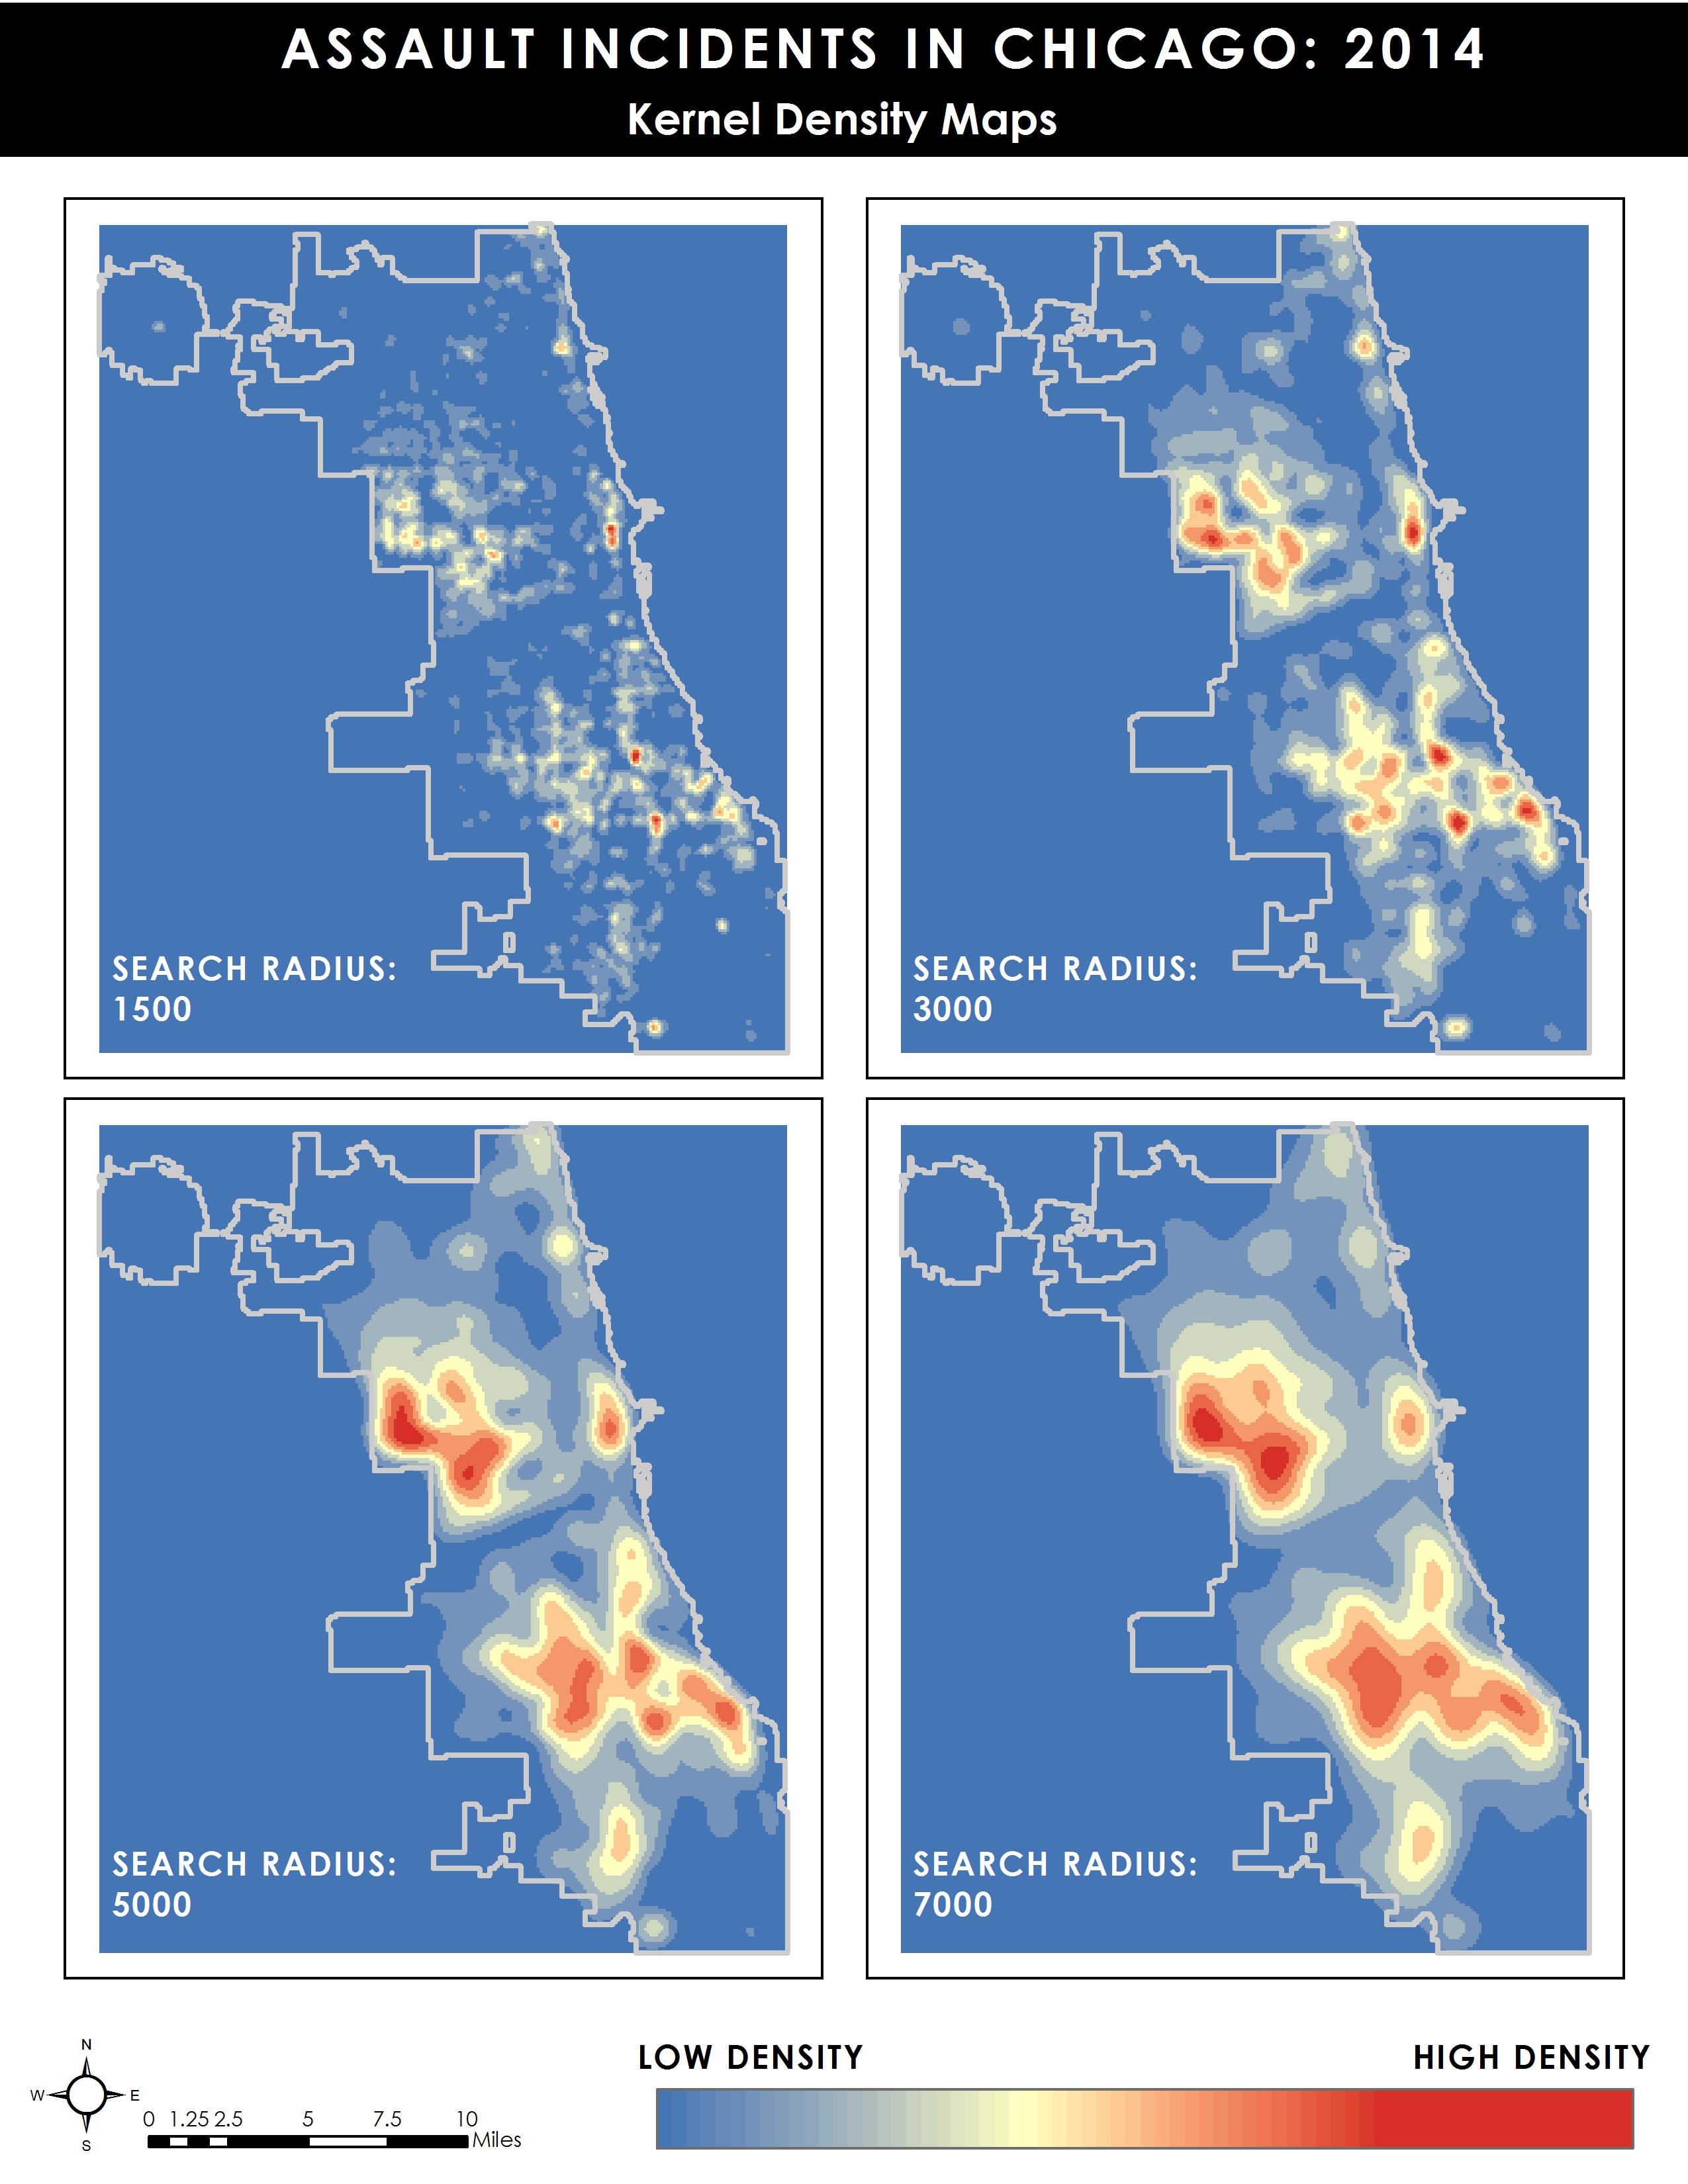
Kernel Density Maps
Showing the density of assault incidents in Chicago in 2014
Showing the density of assault incidents in Chicago in 2014
Risk Terrian Model (RTM) identifies risky locations for crime, provides real-time risk assessments about the context of crime incidents, and
enhances the situational awareness of law enforcement.
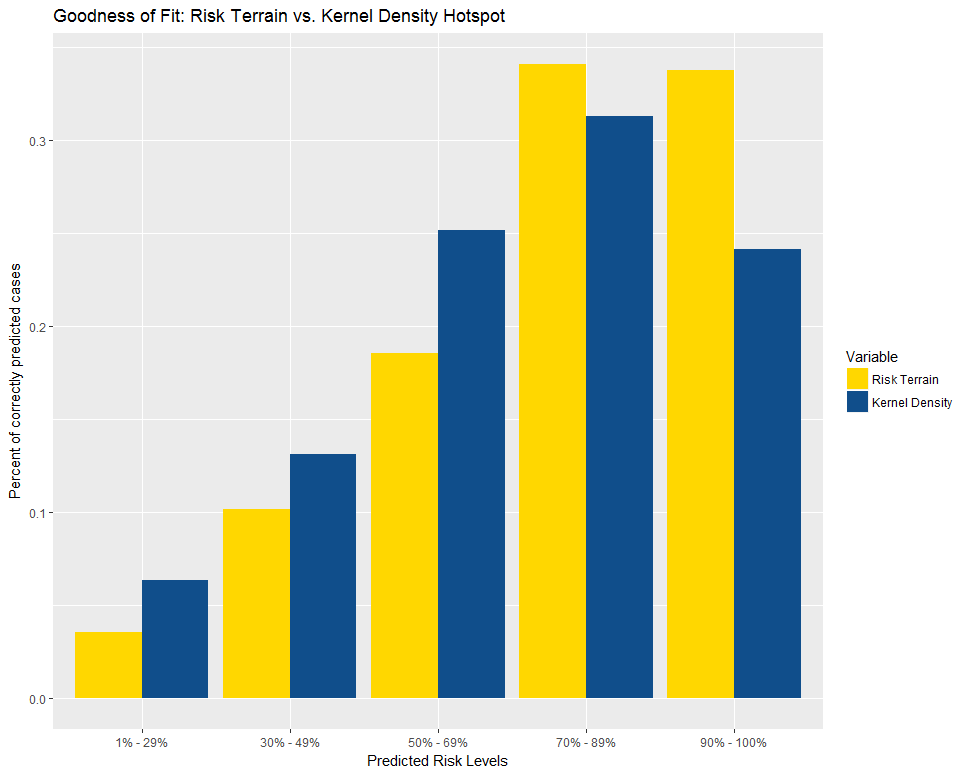
In this project, I trained a Poisson regression model on 2014 assault incidents in Chicago, created choropleth maps to visualize the risk terrain model and individual predictor variables, visualized the ranking of predictor variables from the most influential to the least based on standardized coefficients, and finally examined the goodness of fit of the RTM by comparing the number of assaults correctly predicted by RTM and a
kernel density map distribution.
Risk Factors & Regression Result
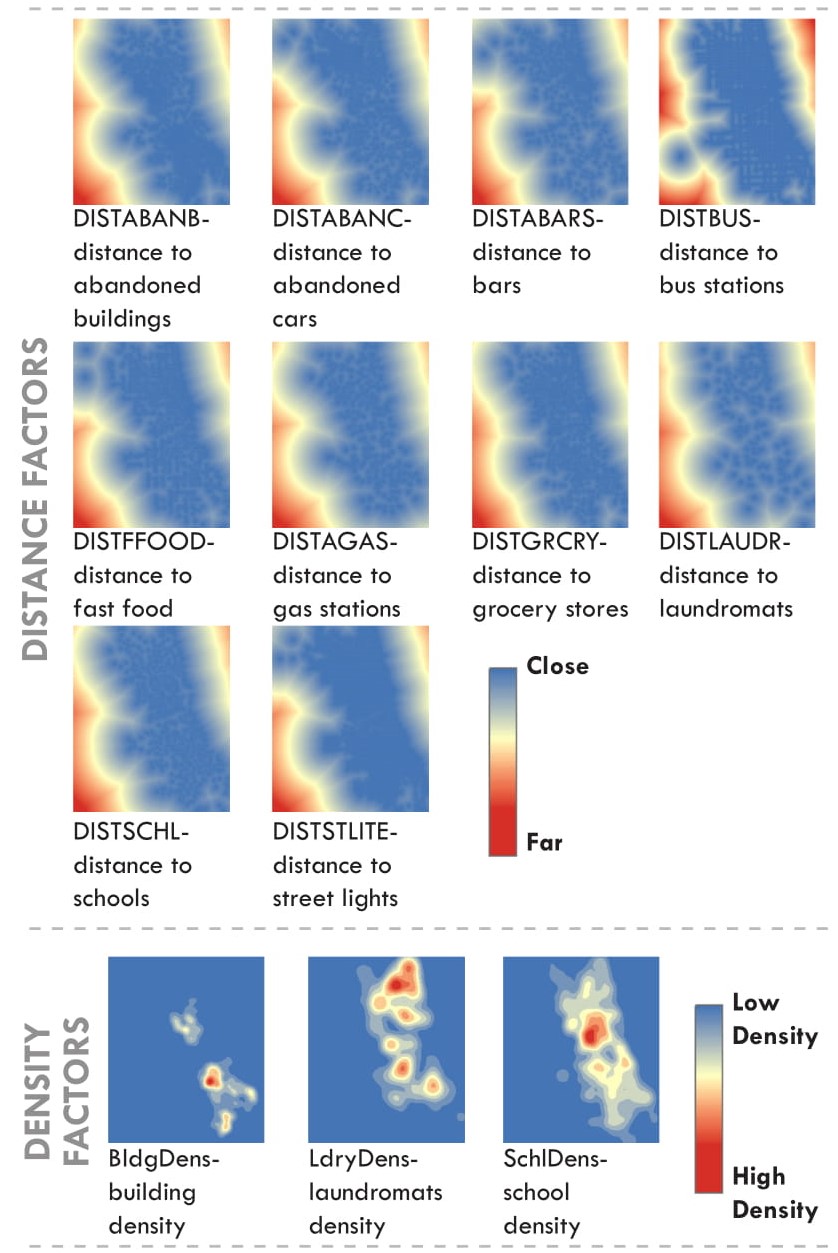
13 Significant Risk Factors
13 Significant Risk Factors
For the Poisson regression, the dependent variable is assault crime incidents in Chicago in 2014. Predictors in the model (risk factors) include several proximity factors and density measures.
The model is finalized after several attempts and comparisons based on AIC value.
The final regression model has 13 significant predictors, which are presented above on the left.
RTM Prediction Map
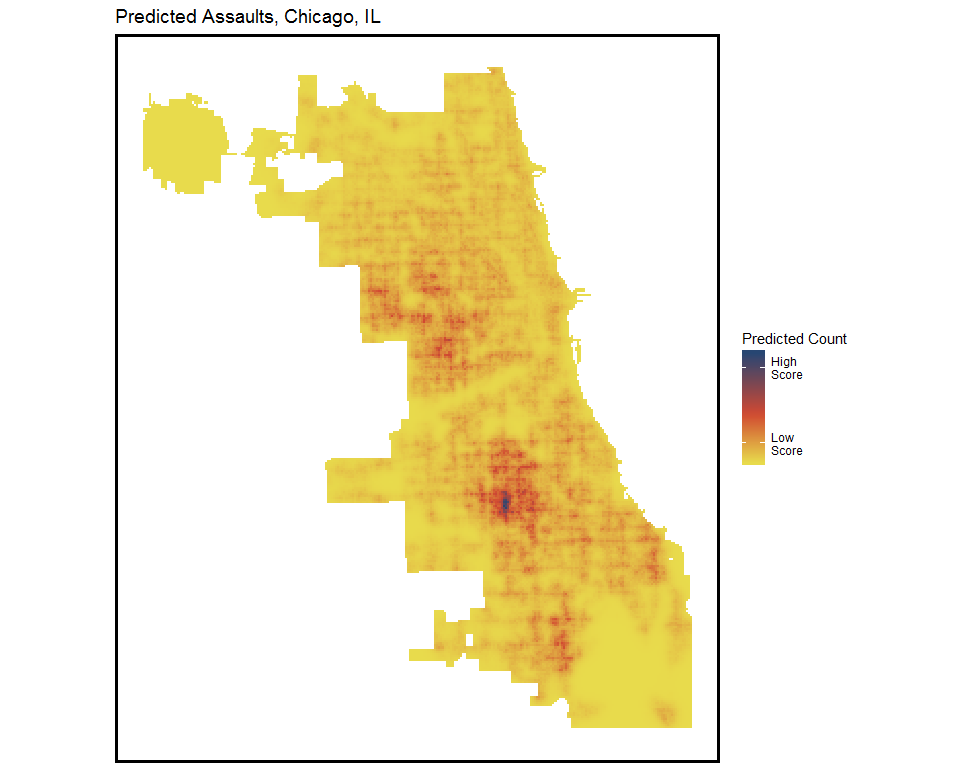
The map above shows the spatial distribution of assault
counts predicted by RTM.
counts predicted by RTM.
Model Analysis
- Influence of risk factors
- Goodness of fit
- Influence of risk factors
- Goodness of fit
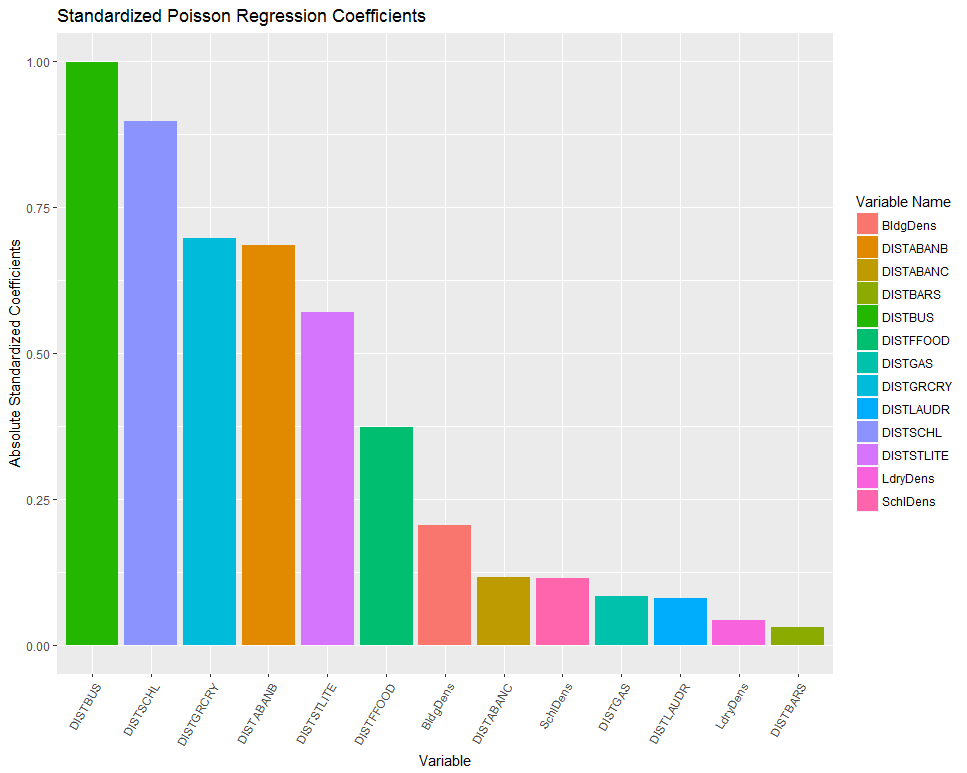
The plot on the left helps visualize which variable brings the most influence
to the prediction model by showing the absolute value of the
coefficient of each varable. W
e can see that the top 5 most influential risk factors are DISTBUS, DISTSCHL, DISTGRCRY, DISTABANB and DISTSTLITE. LdryDens and DISTBARS seem to be no very influential.
The plot on the right shows the goodness of fit of the model by comparing the number of assaults correctly predicted by RTM and a kernel density map distribution. It shows that the RTM does a better job predicting assaults for the top 70% and 90% than top 30% and 50% risk levels. This is what we want because when it comes to policy-making, we care more about high-risk areas with high possibility of assault incidents.
The plot on the right shows the goodness of fit of the model by comparing the number of assaults correctly predicted by RTM and a kernel density map distribution. It shows that the RTM does a better job predicting assaults for the top 70% and 90% than top 30% and 50% risk levels. This is what we want because when it comes to policy-making, we care more about high-risk areas with high possibility of assault incidents.